An Analogue Column Model for Nonlinear Isotherms: The Double-Glazed Vessel Model
Setsuro SUGATA and Yoshihiro ABE
 Return
1 Introduction
Although peak asymmetry may arise from other sources [1], the peak asymmetry of thermodynamic origin is most important for studying asymmetric chromatographic peaks [2]. Asymmetric chromatographic peaks, "tailing" and "fronting", have been explained well by the convex and concave isotherms, respectively [2 - 5]. However, it is not always easy to understand these explanations instantaneously, mostly because they were made without appropriate position peaks (chromatographic peaks that are still on a column [6]). A computer simulation based on the Craig plate model (discontinuous plate model [1]) for the convex (Langmuir-type) isotherm can easily draw a tailing position peak [7]. However, the peak itself is merely a calculated result and does not explain why the peak tailed. Further, a linear isotherm with a small capacity factor (k'<1) also gives a tailing position peak at a small number of transfers of mobile phases, n [7]; of course, this tailing peak becomes more Gaussian as n becomes larger [7], and the chromatogram (exit peak [6]) also becomes more Gaussian as the number of theoretical plates, N, becomes larger [1, 6]. Therefore, these kinds of tailing position peaks represented by ordinary line graphs alone are not useful for the explanation of why these peaks tailed.
The "test tube model" (TT model), an analogue column model manipulated by hand, was devised for the explanation of asymmetric peaks[8]. The theoretical basis of the TT model is the Craig plate model, which has been well illustrated using ideal countercurrent distribution [1, 3, 6]. In the TT model, solute molecules are imagined separated from the solvents and gathered together tightly, and are represented by "water". Therefore, the volume of water denotes the amount of solute. The TT model is exemplified as follows. For the convex (Langmuir-type) isotherm, one theoretical plate consists of a flat-bottomed test tube and trumpet-shaped vessel, which are devoted to forming the shapes of water in the stationary and mobile phases, respectively. At equilibrium, water is partitioned between two vessels according to the isotherm; this equilibration is accomplished by making the water levels in the two vessels the same. Alternate repetitions of the equilibrations and the transfer of the series of trumpet-shaped vessels (mobile phases) to the next plates result in the distribution of water (position peak). The position peak was very useful for the explanation of why the peak tailed. The inverse, a trumpet-shaped vessel (stationary phase) and test tube (mobile phase), represents the concave isotherm. The strong point of the TT model is that the shapes of isotherms can be imagined easily from the combinations of the paired vessels. However, this model requires simple but special glass vessels (trumpet-shaped) and the procedure is rather laborious.
Therefore, a computer program was developed to draw graphically the TT model accompanied by some modifications for better presentation; the modified model was named the "double-glazed vessel model" (DGV model). Then, simulations of chromatography using the DGV model were performed.
2 Concept
The concept of the modified model (DGV model, Figures 1, 2) is essentially the same as that of the previous model [8], the theoretical basis of which was the Craig plate model [1, 3, 6]. At equilibrium, the solute is partitioned between the stationary (S) and mobile (M) phases at each plate, and the partition coefficient, K, is defined as the ratio of the concentrations (CS and CM ) of solute in two phases :

In linear isotherms, this ratio is independent (in nonlinear isotherms, dependent) of solute concentrations. The capacity factor, k', is defined as the ratio of the amounts (nS and nM) of solute in two phases:
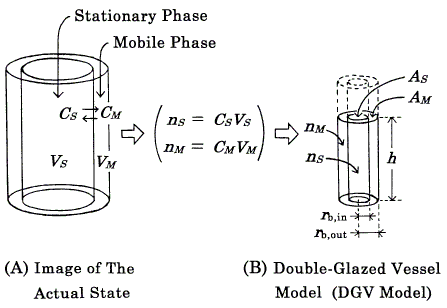
Figure 1. Concept of the "double-glazed vessel model" (DGV model) exemplified by a linear isotherm. A and B represent the same equilibrium state of one kind of solute at a given plate in a column. In the DGV model, solvents are omitted and the solute (full lines) is in a vessel (broken lines). The solute levels (h) in the two compartments are the same (equilibrium state). The volume of solute in each compartment denotes the amount of solute (n), not phase volume (V); also, each compartment does not mean the whole of each phase and is drawn with adequate height. Other symbols: C, concentration of solute; A, averaged cross-sectional area of solute; rb, radius at the bottom. For details, see the text.

where VS and VM are the phase volumes. Under the assumption that VS = VM, the value of k' is equal to that of K, and discussion of the concentration is replaceable by discussion of the amount of solute (Figure 2).
2. 1 Solute
Solute molecules of the same kind in each phase (Figure 1A) are imagined separated from the solvents and gathered together tightly in intrinsic shape (Figure 1B). In the DGV model, the "mass of gathered solute molecules" is considered to be liquid, and is referred to merely as "solute" hereafter. Of course, the volume of solute denotes the amount of solute (nS and nM in Figure 1B and Figure 2), and is represented in milliliters.
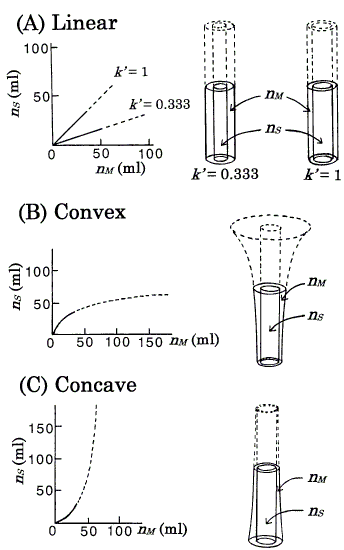
Figure 2. Isotherms ordinarily represented (left) and the corresponding isotherms represented by the DGV model (right). Under the assumption that VS = VM, the nS - nM graph is equal to that of CS - CM. Langmuir coefficients of B (Eq.4) and C (Eq.5) are: a = 77.4; b = 0.0232 [8]. Values of k' at the origins: B, 1.796 (ab, from Eq.4); C, 0.557 (1/ab, from Eq.5). Each figure is exemplified by the state, nS + nM = 68.6 ml; at this amount, B and C correspond to k' = nS/nM = 1. rb,out (in A) = 1.63cm, rb,in (in B and C) = 1.15cm, and other radii are derived (see section 3). AM's in the nonlinear isotherms depend on the amount of solute. For details, see the text.
2. 2 Vessels and isotherms
An isotherm is represented by pouring solute into a vessel (DGV model, Figures 1, 2). The DGV model has a double wall, and the inner and outer compartments are devoted to forming the shapes of solute in the stationary (S) and mobile (M) phases, respectively. As the location of two phases is close to the actual state, in which the mobile phase exists around the stationary phase, it is easily understood. The inner wall has a pinhole near the bottom, through which the solute can move freely. Therefore, the solute levels (h) in the two compartments become the same (equilibrium state). As this representation of equilibrium state is reasonable, it is easily understood. In the DGV model, the capacity factor (Eq.2) is represented by the ratio of the "averaged" cross-sectional areas (AS and AM) of solute in two phases:

This is a fundamental equation for the TT and DGV models, and suggests that many models can be used for one isotherm; for example, in the TT model [8], a linear isotherm (k' = 1) could be represented by three pairs of thin test tubes, thick test tubes, and trumpet-shaped vessels. In the DGV model, for ease of understanding, the inner walls for all isotherms are made cylindrical (Figure 2), i.e. the values of AS remain constant with increasing value of h. In the linear isotherms, as the values of k' are independent of the amount of solute (nS and nM ), i.e. as the values of AM also remain constant (from Eq.3), the outer walls also are cylindrical (Figure 2A). The convex (Langmuir-type) isotherm is represented as

In this isotherm, because the value of k' decreases (AM increases from Eq.3) as nS and nM increase, the outer wall is trumpet-shaped (Figure 2B); this isotherm has a maximum value of h. The concave (anti-Langmuir type) isotherm is represented as

Equation 5 is identical to the inverse function of Eq.4: nM = abnS/(1+bnS). In this isotherm, because the value of k' increases (AM decreases from Eq.3) as nS and nM increase, the outer wall is tapered and becomes closer to the inner wall (Figure 2C). The Langmuir coefficients in Eqs. 4 and 5 are determined as the same values as in the previous model [8] for ease of reference (Figure 2).
For nonlinear isotherms (Figure 2B and Figure 2C), although it is difficult to estimate the value of AM precisely by eye, the following are easily understood. For the convex isotherm, with higher h, AM becomes larger. For the concave isotherm, with lower h, AM becomes larger. These are sufficient for the explanation of asymmetric peaks (section 4.3). For one kind of solute under a given set of conditions, a column consists of a series of one kind of vessel (in Figures 3, 4, vessels are omitted for simple presentation).
3 Calculation Methods
All calculations and drawings of figures were performed using an NEC Model PC-9801/9821 personal computer with a program written in BASIC (N88BASIC(86)). The program is available on request to the committee on software distribution of The Chemical Software Society of Japan (CSSJ).
The amounts of solute (nS and nM) distributed in each plate (the plate number, j) at a given stage n were calculated as described [7] (fundamental calculations). The calculated values are necessary for the drawing of Figures 3, 4; the arrows, the ordinary line graphs, and chromatograms in Figures 3, 4 were easily drawn from the values. A chromatogram is a series of nM values leaving the last plate of the column.
For the drawing of outlines of solute (vessel also) in Figures 2 - 4, it was necessary to predetermine the paired radii of the inner outline (rb,in) and outer outline (rb,out) at the bottom. If the paired radii give the value of k' at the origin of a given isotherm, these radii can be determined arbitrarily (Eq.3). If one radius is determined, the other is derived from Eq.3; for example in Figure 2A, rb,in = 0.815 cm is derived from rb,out = 1.63cm and k' = 0.333 = 1/3, because AS/AM = rb,in2/(1.632 - rb,in2) = 1/3. For ease of reference, the values of rb,in and rb,out in Figures 2 - 4 are determined by referring to the previous model [8].
To draw outlines, relationships between the volume of solute (V) and h, i.e. h = f(V), are also necessary. In the following equations, the AS's of all isotherms and AM's of linear isotherms are constants. In all isotherms, the relationships on the inner outlines are represented as

where V = nS. In all isotherms, for the relationships on the outer outlines, V is represented as

For linear isotherms, the relationships on the outer outlines are represented as

For the convex isotherm, the relationship on the outer outline is obtained from Eqs. 4 and 7 by replacing nS with ASh as follows:

where Z = (bV + ab + 1)2 - 4ab2V. Similarly, for the concave isotherm, the relationship on the outer outline is obtained from Eqs. 5 and 7 by replacing nS with ASh as follows:

where Z = (bV - ab - 1)2 + 4bV , which is identical to Z in Eq.9.
Each of the inner and outer outlines of solute (vessel also) in Figures 2 - 4 is drawn as a series of thin truncated cones with constant volume (dV) [9]. Although the volume (dV) can be determined arbitrarily, a small value is preferable. The radii of the base and roof, and the height of the truncated cone are given as rB, rR, and dh, respectively. The value of dh is obtained from the relationship, dh = f(V0 + dV) - f(V0). At the start, rB=rb,in (or rb,out), and V0= 0. Then, rR is obtained from the values of rB, dV and dh. After replacement of the value of rR by the new rB and adding the constant dV to V0, the next calculation is performed. These calculations are repeated until V0 + dV reaches the given value of V obtained from the fundamental calculation (see above).
4 Results and discussion
4. 1 Chromatographic process
In the Craig plate model [1, 3, 6], column operations consist of two kinds of processes: the equilibration of solute molecules between the stationary and mobile phases, and the subsequent transfer of the series of mobile phases to the next plates. Alternate repetitions of these two processes transfer the solutes at their intrinsic rates. In the DGV model, the transfer of mobile phases is performed imaginarily by the transfer of the series of solute (nM) in the outer compartments to the next outer compartment in the next plates (with pure mobile phases). A computer simulation of chromatography using the DGV model can represent the equilibrated state at a given stage n; if necessary, the chromatogram represented by an ordinary graph is also included (Figures 3, 4). The simulations were performed easily with changing parameters, k', a, b, N, and nt (sample size, i.e. total amount of solute loaded). The band profile with low h at both edges of the band and high h at the center (exactly, not edge) is observed not only in the linear but also in nonlinear isotherms after several transfers (Figures 3, 4). Their shapes, with the exception of the linear isotherm (k' = 1), are asymmetric at early stages (small n). On the other hand, their chromatograms with small N show a stronger tendency toward tailing [6, 8].
4. 2 Symmetric peaks (linear isotherms)
Simulations for the linear isotherms (Figure 3) are fundamental, and form the basis of those of nonlinear isotherms. The amount of solute (nS + nM) in each plate in Figure 3A is equivalent to the corresponding value in Figure 3B (calculated as described [1, 3, 6, 7]); of course, h of that in Figure 3A is proportional to the value in Figure 3B.
The migration velocity (v) of the solute band in the column is proportional to the retardation factor [2, 5], 1/(1 + k'):

where c is a proportional constant.
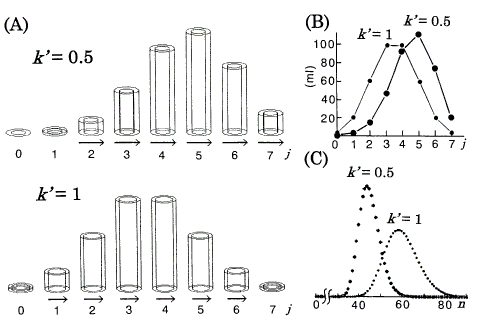
Figure 3. Computer simulations of chromatography using the DGV model for linear isotherms. nt (total amount of solute) = 360 ml. A: Position peaks (equilibrated states) represented by the DGV model at stage n = 7. Vessels are omitted. rb,out = 1.63cm. j : the plate number. Arrows (neglected in plates with less than 1% of nt) represent band velocities, v (Eq.11). B: Position peaks (ordinary graphs) corresponding to A. C: Chromatograms with N (number of theoretical plates) = 30. n: the number of transfers.
The characteristic retention behaviors for the linear isotherms are as follows, and are directly understood by referring to Figures 2, 3 (if necessary, see Eqs. 3 and 11). As the value of k' is independent of the amount of solute, each position peak has its constant value of v in all parts of the band. Therefore, the early asymmetric position peak approaches a Gaussian (symmetric) distribution with increasing value of n [1, 6]; the constancy of v is a strong reason for the process toward a Gaussian distribution. As the tendency toward tailing is weakened, the chromatogram (Figure 3C) also approaches a Gaussian distribution with increasing value of N [6, 8]. The differences between the exact Gaussian profiles [1] and the chromatograms (Figure 3C) are very small. From the comparison of two isotherms (k' = 0.5 and 1), as the value of AM increases relatively to AS (k' decreases from Eq.3 ), i.e. as much solute is transferred (relatively to the amount of solute remaining in the stationary phases), v increases (see Eq.11) and so the retention time (tR) in the chromatogram decreases. The absolute values of v are represented supplementarily by the length of the arrows (Figure 3A).
4. 3 Asymmetric peaks (nonlinear isotherms)
Simulations for the nonlinear isotherms are shown in Figure 4. The amount of solute (nS + nM) in each plate in Figure 4A is equivalent to the corresponding value in Figure 4B (calculated as described [7]); but, h of that in Figure 4A is not proportional to the value in Figure 4B.
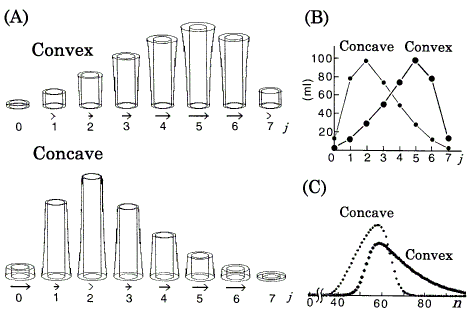
Figure 4. Computer simulations of chromatography using the DGV model for nonlinear isotherms. Langmuir coefficients are in Figure 2. nt = 360 ml. A: Position peaks (equilibrated states) represented by the DGV model at stage n = 7. rb,in = 1.15cm. Vessels are omitted. Arrows (neglected in plates with less than 1% of nt) represent relative band velocities, vrel (Eq.12). B: Position peaks (ordinary graphs) corresponding to A. C: Chromatograms with N = 30.
Asymmetric peaks caused by nonlinear isotherms have been explained well by the difference of v between the positions of the band [2, 3, 5, 8]. In this paper, these peaks are explained by the DGV model likewise. The following can be directly understood by referring to Figures 2, 4 (if necessary, refer to Figure 3 also). In these isotherms, the value of k' is dependent on the amount of solute; in the DGV model, AS is independent of the amount of solute, but AM is dependent. Therefore, against the tendency toward Gaussian profile, the asymmetries of the early asymmetric position peaks are maintained with increasing value of n as follows; also in their chromatograms, as the tendency toward tailing is weakened with increasing value of N [6, 8], the asymmetries are maintained. In a convex isotherm, as the value of AM at the center of the band is larger (k' is smaller, from Eq.3) than those at either edge, i.e. as much solute is transferred (relatively to the amount of solute remaining in the stationary phase) at the center than at the edges, the center moves faster than the edges and so the chromatogram exhibits tailing. Conversely, in a concave isotherm, as the values of AM at the edges are larger (k's are smaller, from Eq.3) than the center, i.e. as much solute is transferred (relatively to the amount of solute remaining in the stationary phase) at the edges than at the center, the edges move faster than the center and so the chromatogram exhibits fronting. The relative values of v (vrel) are represented supplementarily by the length of the arrows:

where vlow is the lowest value of v in the band, and 3 is an arbitrary numeral for the magnification of vrel. In Figures 3, 4, c (in Eq.11) is the same value fixed arbitrarily.
The sample size (nt) affects retention behavior (values of k', v, and tR) and peak shape [2, 4]. As the sample size decreases, the retention behavior and peak shape approach those of a linear isotherm with k' value at the origin of the isotherm. The simulated results of position peak and chromatogram for the convex isotherm agreed well with those of the TT model [8] under the same conditions (a = 77.4, b = 0.0232, nt = 192 ml, n = 4, and N = 10); in the position peaks, the data of h at each plate were compared.
The position peak represented by the DGV model (in Figure 3A and Figure 4A) is a kind of bar graph with a special function, and explains why one early asymmetric position peak (the peak of k' = 0.5 in Figure 3) approaches a Gaussian distribution, while the other (the peak of convex isotherm in Figure 4) retains asymmetry with increasing value of n. On the other hand, the ordinary graphs (Figure 3B and Figure 4B) alone are not so useful for the explanation, because these graphs provide no information about their isotherms. If Figure 3B and Figure 4B are represented by the components nS and nM, it is generally not so easy to estimate the size of k' from the data by eye.
5 Conclusion
The DGV model (Figures 1, 2) is directly understood, because (・) the location of the solute in the stationary and mobile phases is close to the actual state, (・) the presentation of equilibrium state is reasonable, and (纊) the shapes of isotherms can be imagined rather easily from the shapes of vessels.
Computer simulations of chromatography using the DGV model with changing parameters were performed easily. Position peaks for the linear isotherms (Figure 3) at an appropriate stage are useful to understand the process toward a Gaussian distribution and the fundamental retention behaviors directly. Those of nonlinear isotherms (Figure 4) are also useful to understand asymmetric peaks directly, because the following explanation can be directly understood. The part of the solute band where the value of AM is larger (k' is smaller, from Eq.3) than the other, i.e. the part where much solute is transferred (relatively to the amount of solute remaining in the stationary phase), moves faster than the other. The position peak represented by the DGV model is a kind of bar graph with a special function. The band velocities represented supplementarily by the arrows were convenient for explanation.
References
[ 1] Guiochon, G., Shirazi, S.G. and Katti, A.M., Fundamentals of Preparative and Nonlinear Chromatography, Academic Press, Boston (1994), chap. VI.
[ 2] Horvath, Cs. and Melander, W.R., Chromatography: Fundamentals and Applications of Chromatographic and Electrophoretic Methods. Part A: Fundamentals and techniques (Journal of Chromatography Library Vol.22A), ed. by Heftmann, E., Elsevier, Amsterdam (1983), chap. 3.
[ 3] Gaucher, G.M., J. Chem. Educ., 46, 729 (1969).
[ 4] McDonald, P.D. and Bidlingmeyer, B.A., Preparative Liquid Chromatography (Journal of Chromatography Library vol.38), ed. by Bidlingmeyer, B.A., Elsevier, Amsterdam (1987), p.38.
[ 5] Scott, R.P.W., Liquid Chromatography Column Theory, Wiley, Chichester (1992), p.41.
[ 6] Fritz, J.S. and Scott, D.M., J. Chromatogr., 271, 193 (1983).
[ 7] Sundheim, B.R., J. Chem. Educ., 69, 1003 (1992).
[ 8] Sugata, S. and Abe, Y., J. Chem. Educ., 74, 406 (1997).
[ 9] Sugata, S., ACH-Models Chem., 136, 349 (1999).
Return